
Creators! We can't wait to share the newest addition to the AMP toolset! We now offer Track Reporting, the most in-depth insight yet into the performance of your content on Pandora. Track Reporting can now be found via the Catalog Tab on your AMP artist page.
What is the Catalog Tab?
The Catalog Tab now hosts our newest AMP feature, Track Reporting! AMP users with access to an artist page can now see total Streams, Radio Spins, Interactive Plays, Station Adds, and Thumbs Up for each track right on the Catalog Tab, where they’ve previously clicked to see all the tracks they’ve delivered to Pandora.

WHAT DATA IS AVAILABLE IN THE CATALOG TAB?
Pretty much everything! You can now click on a track to dive into a reporting page dedicated to that track, featuring a line graph for daily trends as well as a “source breakdown” section, showing which programs your track is being streamed on. All metrics are available with custom date ranges as well. Together, these features offer a series of improvements on the way Pandora data has been presented in Next Big Sound, and ultimately eliminates the need for users to navigate to a separate platform for this reporting.
HOW DOES TRACK REPORTING WORK?
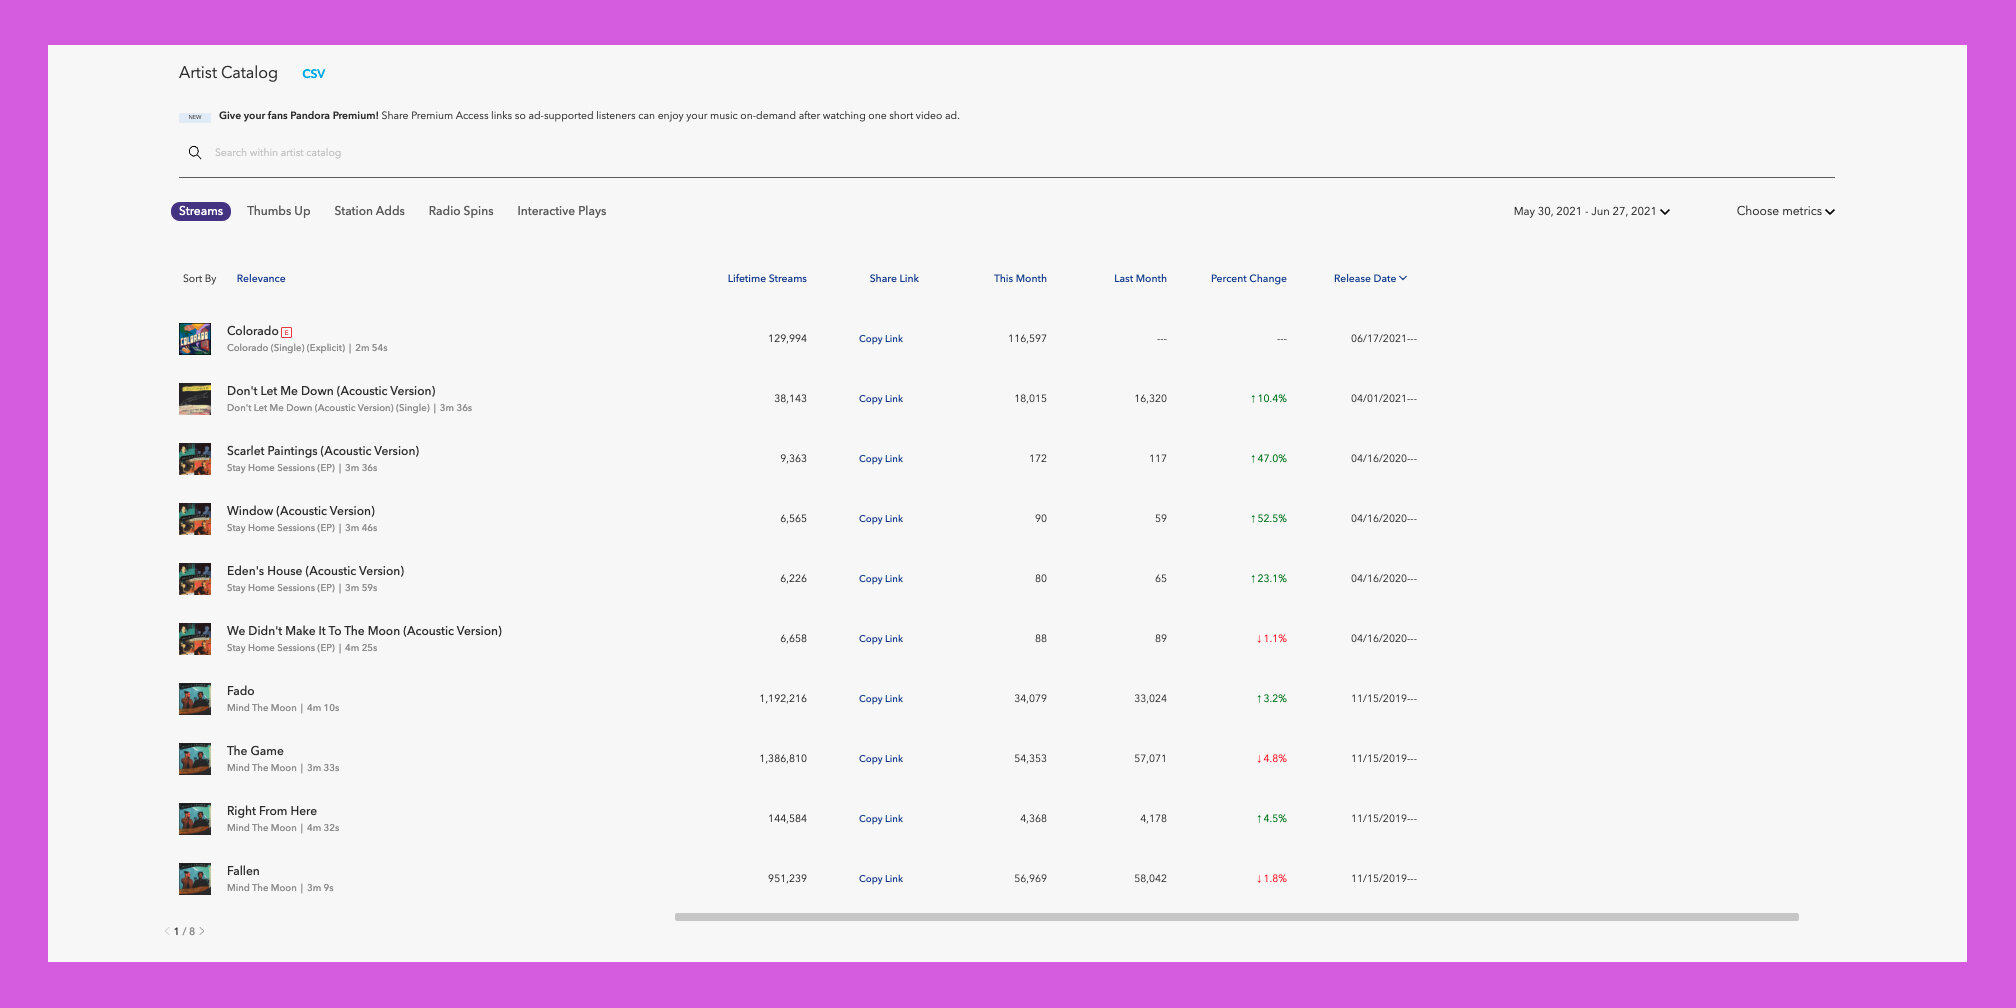
Navigate to the Catalog tab and you’ll see the tracks you have spinning on Pandora. Also displayed will be lifetime streams, a share link, streams this month, last month, percent change, release date as well as a confirmation that the track qualifies for Premium Access.
Now click on a track, and it will open a details page specifically designed for this track. The details page displays high level data (streams, station adds, etc.):

As well as a line graph for daily trends:

Under the Catalog Tab for the band Milky Chance, you can see the sizable spike in listening for the song “Colorado” in its first week.
Scroll further down and you’ll find “Source Categories,” which can be seen on the pie chart in the image below. Source categories are organized into three sections: “Algorithmic,” “Editorial,” and “Organic.”
Here’s a breakdown of each category:
“Algorithmic” sources are those primarily driven by recommendation algorithms. This includes other artists’ radio stations and autoplay from any source.
“Editorial” sources include all genre stations, editorial playlists, and mixtapes.
“Organic” sources are primarily driven by listener choice: an artist’s own radio station or an artist’s own track station.
By clicking a section of the pie chart, you’ll be able to see the top 10 sources in each category, which can be sorted by streams, thumbs, or listeners.

Since “Colorado” is a new release, its spins are being primarily driven by editorial stations like Today’s Alternative and New Pop. When fans are starting to seek out your music organically, Pandora’s Music Genome algorithm begins learning to play it on your artist station – and as it learns more, your music will start playing more frequently and on various other stations.